Create Polar Diagram
This is a howto, describing the process of creating a polar diagram for your sailing vessel. Most terms were new for me as well, so that’s why I made this page as a reference. See also this article for some more information. The reason we want a correct polar diagram is to determine the optimum boat speed and use this information to plan routes.
To display a polar diagram, we can use Polar Tables to determine the fastest angles and target boat speed.
First some terms being used:
BEAT ANGLES: The best course to stear for an upwind course (usually around 45 degrees)
BEAT VMG: The Velocity Made Good, the speed made directly upwind (always less then boat speed)
RUN VMG: The Velocity Made Good, the speed made directly downwind (always less then boat speed)
GYBE ANGLES: the best angle to sail downwind with the best VMG, usually around 150 degrees with little wind and potentially 180 degrees in a lot of wind.
When sailing upwind, we don’t steer to the VMG, because this will cause us to steer higher and higher until all speed is gone and the VMG will drop. A better
TARGET BOAT SPEED: the optimal speed, if you are going faster, head up higher, if slower, go down.
REACHING PERFORMANCE: this percentage value gives us a clue about our performance on a free leg.
Now it’s time to start with our polar diagram, and there are 2 options:
- Copy a similar polar diagram and finetune this for your ship and your sail inventory
- Start from scratch (which is a lot of work)
For describing how a polar diagram works, let’s start from scratch. Now would be the time to start sailing and record a lot of windspeed, boatspeed, course and sail information. This is what the endresult should look like:

The above polar diagram and polar table can be used during sailing. The diagram needs a software program on the PC to make sense. There is a course line in the above diagram, at 92 degrees, this is the current heading. At the course line we cross several lines which indicate the target speed at several windspeeds.
The blue line(second line from the inside) is the target speed(6.73 knot) for a 8 knot windspeed. Use the polar table to check these values.
Create your own polars
Start by creating a new polar diagram, I’m going to use Stentec’s WinGPS 5 Voyager for this, and the first info we need to enter is the length of the boat (for determining the maximum hull speed) and the maximum speed visible in the diagram (the above diagram was limited at 10 knots boat speed).
Recording
Now it’s time to start sailing under different windconditions and record the boat speed achieved and the wind angle (this is a lot of work, because you want to do this for about 9 wind angles and do this at around 7 windspeeds. Also, when sailing, wind conditions will vary, making the measurements even harder. This is a good reason to start with a similar Polar diagram and adapt it to your ship. For practicing this, I use Stentec’s Sail Simulator 5, with NMEA output. Now I can sail a simulated ship at a steady windspeed. All controls inside WinGPS stay the same.
Open up your empty polair diagram in WinGPS and start sailing, press the Record button, and enter a name for this recording session (e.g. “Wind steady 10 knots flat water”) so you can open up your multiple recordings later on, and still know the conditions. Also when using multiple sails, record this. At least sail 30 seconds on each course, to get some good readings.
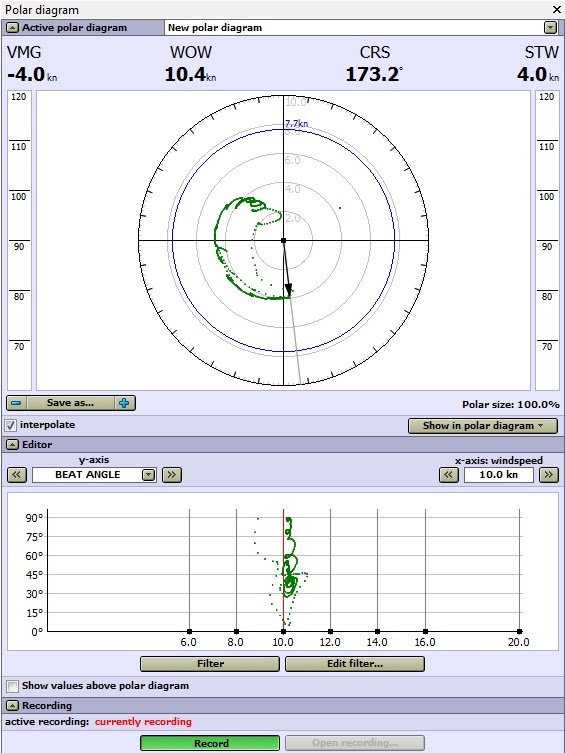
This will result in a screen like on the right, with lots of recorded information, at all courses in a steady 10 knots wind. Most recorded sessions will include much more information.
So let’s start by examining the screens, the top one is the Polar diagram, and it displays the speed at the different courses. At 45 degrees there are some circles, due to sailing to high, slowing down, picking up speed and pointing higher again. Also the VMG, WOW (wind over water), CRS (course) and STW(speed through water) are here.
The scales on the left and right (70% - 120%) are used when our polar diagram is completed and will tell us if we are on target VMG and speed (100%) or lower or faster.
Below the diagram is the editor, with different recorded values (y-axis) for beat angle, beat vmg, the 52-180 degrees, run vmg and the gybe angle. It’s not possible to do anything usefull yet with all these recorded values. We need a filter to even all values.
The x-axis is of no use yet, and doesn’t display anything inside the editor window. It will display the appropriate polar information in the above polar diagram for that windspeed.
The Recording screen is the one you’ve used to start a recording, or we can open up older recordings to finetune our polar diagram.
Filtering
Now press the “Filter” button, inside the editor screen. This will filter out all strange values, by averaging all recorded values for at least 30 seconds (we can change all of this with the “Edit filter” screen.) If there is enough information recorded, some recorded data is still visible at each of the angles.
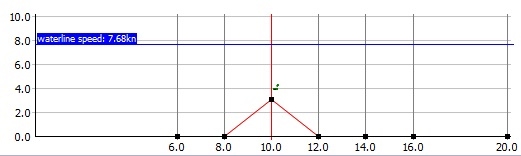
To create the diagram, we’re going to enter the recorded speed/angle inside the editor, and we can do this by selecting the bleck dot at the right windspeed (10 knots in this case) and move it up untill the recorded value.
Do this for all the angles and the run vmg and beat vmg.
This was the first step, now sail at 6, 8, 12, 14, 16 and 20 knots and do the same again. Keep on tuning your polar diagram, because with changing conditions, doing a good run will be difficult. Press the “Show in polar diagram” button and select “show time-filtered recording values. Now fine tune all values until you end up with a screen like on the top of this page. If the wind is 11 knots, you’ll have to change the 10 and the 12 knots values. Keep watching the polar diagram, and try to even out all values until the curves are right.
Another way is by using the polar diagram manager, and editing the values directly in the table, just keep a good record of all the changes you make.
Keep on sailing and updating your polars!